
(406) 206-7571
The first half of the year has reminded us that the stock market rarely grows in a straight line. It has reacted to changing economic data, rumors about the future of interest rates, geopolitical events (war, changes in international trade policy/preference, etc.), Congress’s inability to function, and continued drama around investing in artificial intelligence. In the midst of the instability, we have seen strong returns in the first half of the year.
On one side, we’ve seen people recognize much of the instability that shows up in the headlines. When we speak with these people, we look at history, which reminds us that markets have consistently rewarded disciplined, strategic, long-term investors who don’t forget about the basic rules of investing. Time in the market matters, and not every business has the same risks. When you look at each business in your portfolio on its own merits, and take care to put them together so they complement each other, most of the headlines just become noise.
On the other side, we see many looking at the easy money promised by the AI investment craze. We would remind these people of the old adage “easy come, easy go”. We’ve long said that if it sounds too good to be true, it probably is. Investing indiscriminately in the stock markets at this stage certainly reflects these principles. Good investors aren’t like my dog, Stetson, when he sees a squirrel. They don’t let themselves be distracted by the newest, shiny thing. Instead, they repeatedly buy good businesses that provide consistent passive income.
Market fluctuations happen every year, and 2026 is no exception, but there are also many exciting opportunities on the horizon! In this month’s update, we’ll take a closer look at the current economic landscape, discuss key themes influencing markets today, and share our perspective on what they may mean for you moving forward.
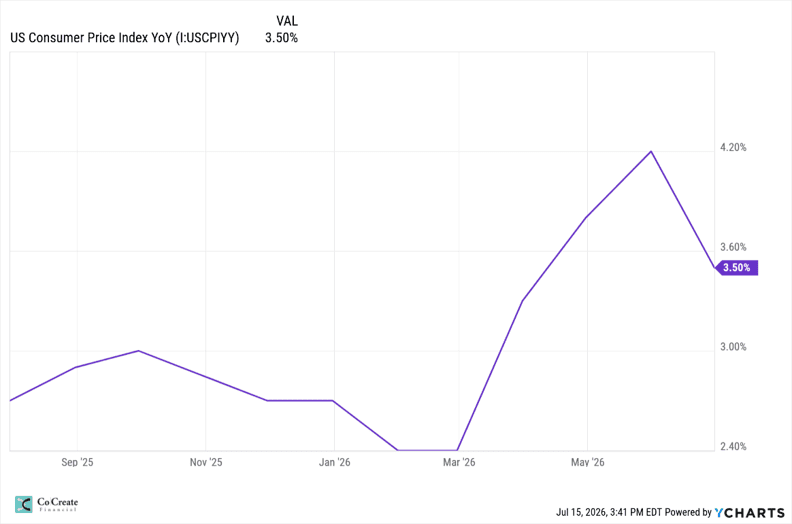
Few topics have received as much attention this year as inflation (again, nothing new), with changing feelings and predictions continuing to influence investors. CPI, or Consumer Price Index, is a measure of how much prices are changing for everyday goods and services over time. The U.S. Bureau of Labor Statistics released a report on July 14, 2026, that stated that CPI was 3.5% as of late June, meaning inflation has risen 3.5% year-over-year. When we look at the month-to-month numbers, inflation has decreased by 0.4%, largely due to the index for energy falling 5.7% in June after increasing consistently in March, April, and May. The question is whether that downward shift will continue into July as uncertainties surrounding the conflict in the Middle East continue to put pressure on energy prices.
While inflation has cooled considerably when we compare it to previous years, it remains high enough that the Federal Reserve, our nation’s central bank that is tasked with using different tools to keep our economy stable, is expected to take a cautious approach before lowering interest rates. For the everyday person, persistent inflation means everyday expenses like groceries continue to cost more than they did a year ago. For investors, inflation is one of the biggest drivers of interest rate decisions, making it an important indicator to watch. But the truth is, interest rates aren’t what drive markets, we can look at what people are investing in to see what the true drivers are.
In recent years, markets have scrutinized every Federal Reserve meeting and public comment closely, often reacting sharply to even small hints about future interest rate decisions. Since taking office, new Federal Reserve Chairman Kevin Warsh has signaled a different approach. Rather than providing detailed guidance about future policy, Warsh has emphasized that markets should focus on the underlying economic data instead of trying to anticipate the Fed’s next move. This is a step in the right direction and a huge positive for investors. Financial markets work best when they are free to move organically and are not being driven by constant speculation over recent headlines on each and every Federal Reserve speech or meeting.
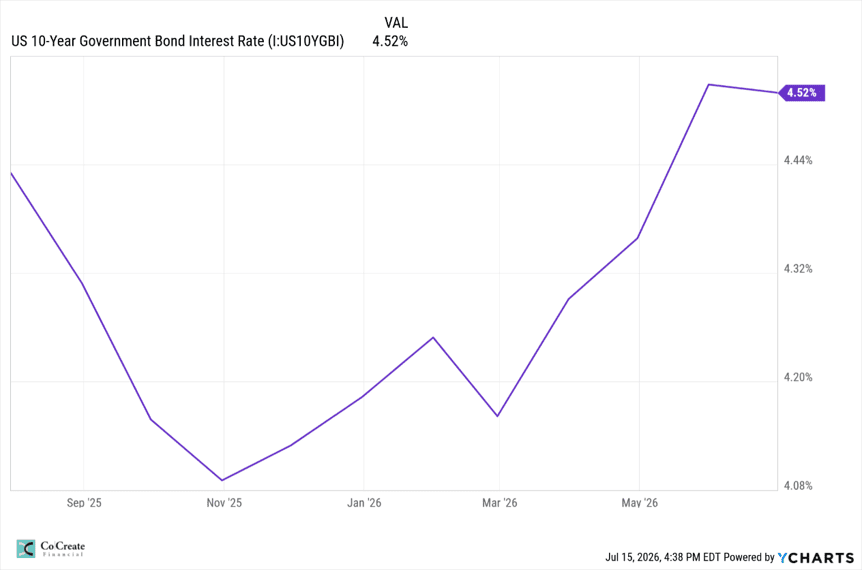
In that same vein, another important indicator to watch is the 10-year U.S. Treasury yield. Closely tied to inflation, the 10-year U.S. Treasury yield is the interest rate investors receive for lending money to the U.S. government for ten years. This rate has a heavy influence on mortgage rates and long-term borrowing rates. But it is important to note that the 10-year U.S. Treasury yield is different than the Fed Funds rate, which has more of an influence on short-term borrowing. Over the past few months, the 10-year Treasury yield has climbed to approximately 4.5%, reflecting expectations that interest rates may remain elevated while inflation continues to moderate. Higher yields generally increase borrowing costs for consumers and businesses, which can slow economic activity.
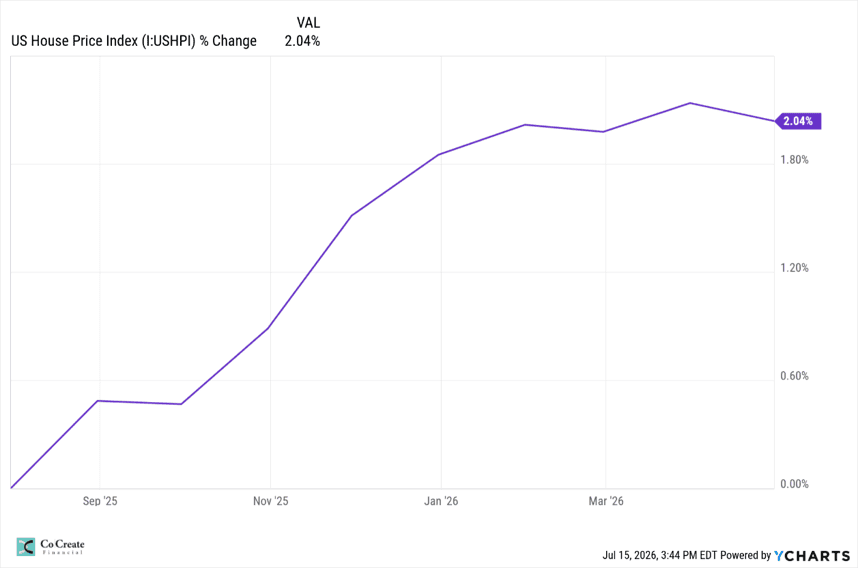
The state of the housing market is another popular topic often on the minds of many Americans. The U.S. House Price Index shows home prices continuing to rise at a modest pace, with annual growth of approximately 2.0%. While higher mortgage rates have made buying a home more expensive, limited housing inventory has continued to support prices by keeping supply tight. So, we’re in an environment where we can do one of two things: hope for rates to come down or build more! Although affordability remains a challenge for a lot of Americans, the steady pace of price appreciation suggests the housing market has found a healthier balance after the rapid gains seen in recent years.
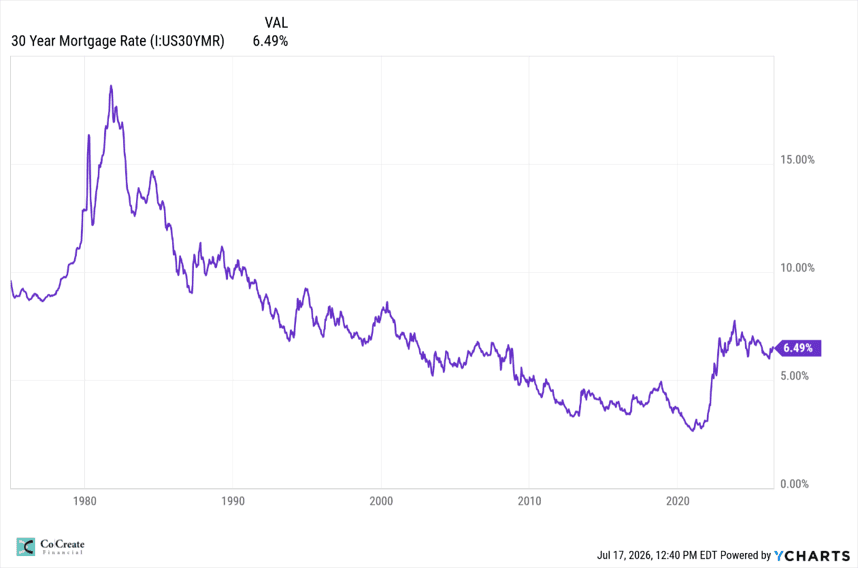
Additionally, mortgage rates of around 6%-6.5% are healthy and historically neutral. Current rates just feel high since we experienced dramatically suppressed mortgage rates after the 2008 housing crisis up until rates started to rise post Covid. The graph below shows how the 30-year rate has changed from 1975 all the way up until 2026, so when we take a more bird’s eye view, current mortgage rates are not in a crazy, rough place.
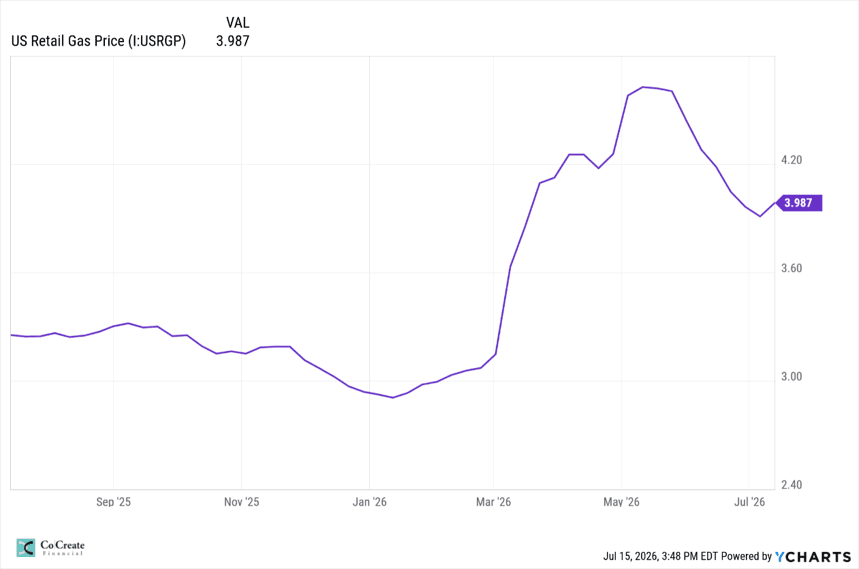
Along with inflation and the housing market, gas prices remain a major concern for many people. Looking at the graph above, we can see that the national average gasoline prices increased sharply this spring before easing slightly in recent weeks, with prices currently averaging around $3.99 per gallon. Gas prices are heavily influenced by crude oil prices, global supply, refinery production, and geopolitical events. Because fuel is a necessary expense for most households, higher gas prices decrease disposable income and can contribute to broader inflation over the long term, while lower prices provide people with more spending power.
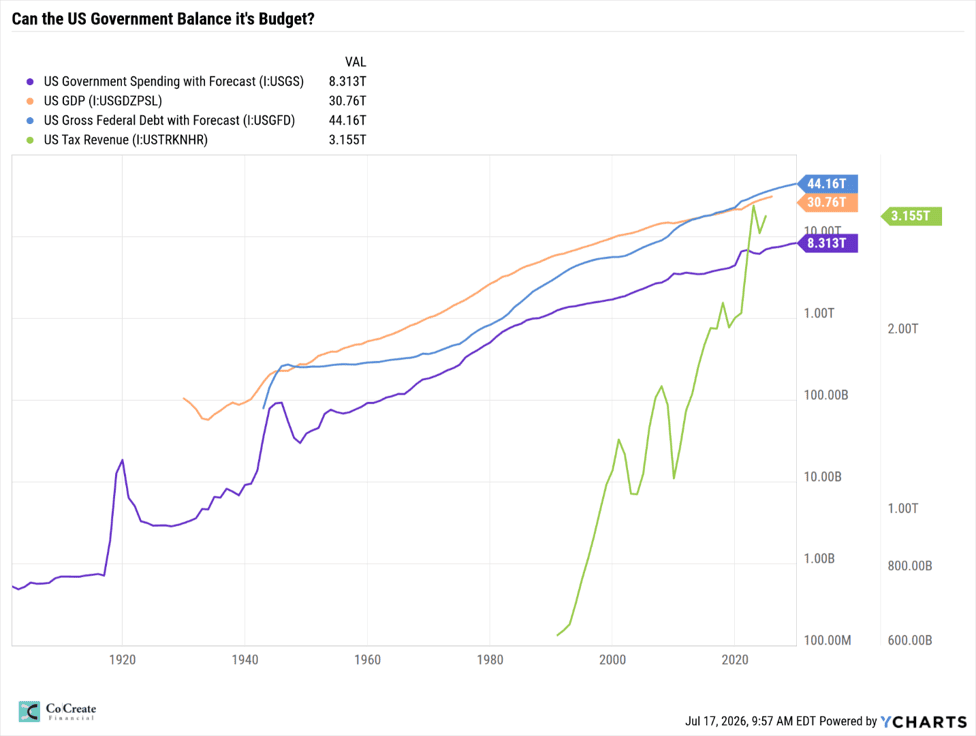
It is no secret that the United States government has a huge debt problem. This chart compares four key indicators of the health of the U.S. economy: government spending, tax revenue, gross domestic product (GDP), and total federal debt. GDP is the total value of all goods and services produced in the United States each year and is commonly used to measure an economy’s size. Ideally, as the economy grows, tax revenue also grows. However, government spending has consistently outpaced tax revenue, creating an annual budget deficit, which is the difference between what the government spends and what it collects in taxes. Those yearly deficits accumulate over time (and accrue a ton of interest), becoming the national debt we see today.
But what does this mean for investors? Rising national debt doesn’t mean the economy or stock market suddenly stops growing. It does mean that the government has less financial flexibility and will eventually have to make a choice between raising taxes or reducing their spending (hopefully they will not choose option C which is to just keep accumulating debt and interest). While there are unknowns about what exact strategy Washington will decide to take, it doesn’t change the significance of staying invested and focused on a long-term plan.
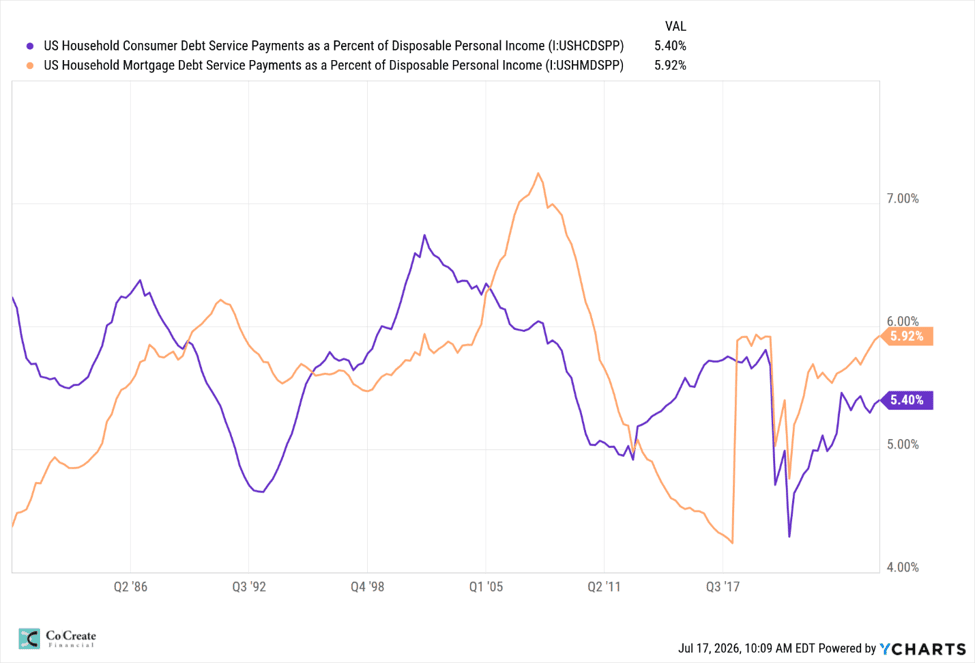
While we are on the topic of debt, let’s look at it from a U.S. household perspective. This graph offers a good illustration as to where we are at as a country on household debt levels by showing the percentage of disposable income (amount of money left after taxes) that U.S. households spend on mortgage payments and consumer debt payments like credit cards, auto loans, and personal loans. Despite higher interest rates over the past few years, debt service payments remain near historical averages. Much of this resilience comes from homeowners who locked in super low mortgage rates around 2020 and people who have generally maintained steady income growth. While financial stress certainly exists in many households across the U.S., the broader picture is relatively solid. One thing to note is that it is clear that that percentage is on an upward trend as more people finance purchases at today’s interest rates. While this is a trend worth watching over time, current levels suggest that, overall, U.S. households remain in a relatively strong financial position. As long as employment stays steady and incomes grow, household balance sheets should remain supportive of the broader economy.
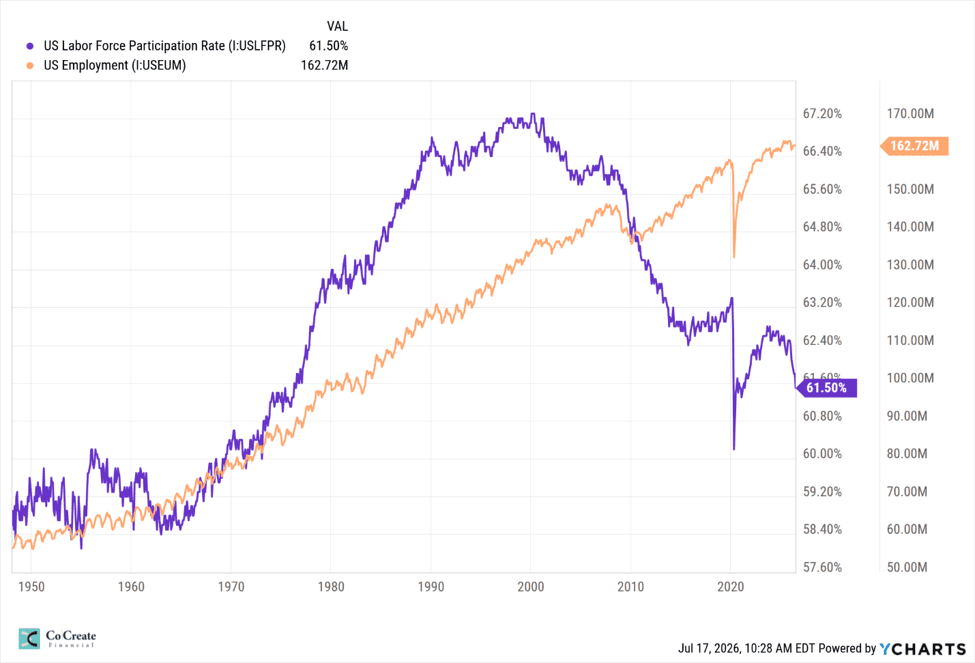
Speaking of employment, the graph above compares two different measures of the labor market: the total number of Americans who are employed and the labor force participation rate, which measures the percentage of working-age adults who are either employed or actively looking for work. While employment has recovered from pandemic lows, the labor force participation rate remains well below its peak from the early 2000s. In other words, there are more Americans working than ever before, but there’s a smaller share of the working-age population who are participating in the workforce.
Several long-term trends have contributed to this shift, including an aging population, increased early retirements, and, in some industries, a mismatch between the skills employers’ need and those available in the workforce. On the positive side, we have seen the number of unemployed workers and job openings fall relatively in line with one another on a national scale. Of course, there will be variations across industries and local economies, but broadly speaking, the United States has bounced back from the labor shortage it experienced in prior years.
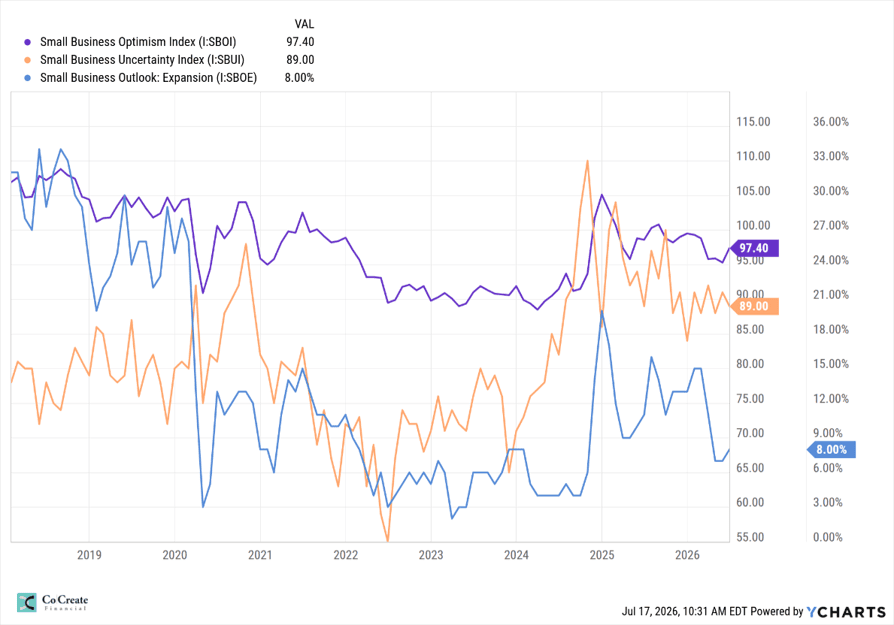
Small businesses are often considered the backbone of the U.S. economy, so their outlook can provide valuable insight into where the economy may be headed. This graph tracks three measures: small business optimism, uncertainty, and plans to expand in the future. While uncertainty remains elevated compared to past levels, optimism has begun to stabilize and businesses are once again showing a greater willingness to invest and grow. Although many business owners continue to face challenges such as higher borrowing costs and labor shortages, the overall trend suggests confidence is gradually improving, which is an encouraging sign for future economic growth.
One of the largest sources of headlines this year has been the conflict involving Iran and Israel. Investors are closely watching developments there since the Middle East produces a significant share of the world's oil, and disruptions to shipping through the Strait of Hormuz, one of the world's busiest oil transit routes, could reduce global energy supplies. Recent tensions have already contributed to higher oil prices and renewed volatility in energy markets. Higher oil prices can eventually work their way into inflation by increasing transportation and manufacturing costs, so it is something to keep an eye on.
Artificial intelligence has been one of the strongest drivers of stock market performance over the past few years, particularly among large tech companies. While AI could represent a transformational long-term opportunity, investors have recently become more selective as valuations have climbed to historically high levels. Rather than questioning AI's potential, the market is beginning to ask whether current stock prices already reflect years of future growth. Companies will increasingly need to demonstrate that heavy AI investments are translating into meaningful revenue and profits, not just speculative growth. I have no doubt that AI will continue to revolutionize innovation and continue to become more useful in daily life, but which companies will come out as winners is where the unpredictability lies.
One potential theme to watch in the coming months is a rotation from high-growth, AI driven tech stocks toward more value-oriented companies. When we think of value-oriented companies, we think of the businesses that are stocking our grocery stores, keeping our lights on, and supplying everyday products we rely on without a second thought. These are companies that provide essential goods and services you and I will continue to use regardless of the economic environment. As investors become more selective and question whether current AI valuations fully reflect future earnings potential, investments may begin shifting toward sectors with lower valuations, more stable cash flows, and established businesses. While artificial intelligence is expected to remain a powerful long-term growth driver, markets often rotate leadership as expectations evolve so we will continue to monitor if any major shifts start to emerge.
We’ve spent some time talking about the challenges in the investment world, but there are also many reasons to remain optimistic. As we celebrate America’s 250th birthday this month, it’s a fitting reminder that innovation, entrepreneurship, and resilient businesses have long been drivers of economic growth and prosperity.
While much of the market’s attention has been on AI, there are many high-quality companies out there with strong leadership, healthy balance sheets, and consistent earnings that continue to create long-term value for their owners and consumers. Corporate earnings have stayed strong, showing that success isn’t only found in a handful of dominating companies.
Artificial intelligence is also entering a new phase. Rather than simply generating speculative excitement, businesses are increasingly finding new ways to apply AI practically to boost productivity and efficiency. As adoption across sectors expands, opportunities may go beyond the companies developing AI to those using it to strengthen their business models.
While productivity gains from major technological advances can take years to fully materialize, history suggests that patient, long-term investors are often rewarded as innovation becomes more embedded across industries.
The challenges we’re seeing today are not out of the ordinary to long-term investors. Markets will always have ups and downs, and today’s environment is no exception. Geopolitical events and changing expectations around artificial intelligence may continue to create short-term volatility, but they don’t change the long-held principles of disciplined investing.
Rather than reacting to every headline, we believe it’s important to stay focused on what matters most: owning high-quality businesses, maintaining a strategically diversified portfolio, and keeping your investments aligned with your long-term goals. Taking a calculated diversification approach allows us to avoid putting all our eggs in one basket, helping create a more resilient portfolio over time.
History reminds us that patient investors have been rewarded over time. Since 2000, the S&P 500 has delivered average annual returns of roughly 8%. While long-term market growth is an important driver of accumulation, successful investing is about more than simply participating in the market. A thoughtful financial plan includes a well-designed distribution and liquidity strategy, ensuring you have cash available when you need it without being forced to sell investments during periods of market downturns. This approach helps make retirement income more sustainable while allowing the rest of your portfolio to remain invested for long-term growth.
Above all, we believe successful investing is about more than managing a portfolio, it’s about helping navigate what we can’t control with confidence and what we can with clarity. Markets will continue to evolve, but your financial plan should provide you with stability through every stage. We remain committed to helping you make thoughtful decisions, adapt when needed, and stay focused on the goals that matter most to you.
Hi everyone! This is my first time sending out an annual market review, and I am excited to share it with you all. As we leave 2025 and enter 2026, we all at CoCreate are feeling energized and hopeful for what’s to come.
Financial markets do not move in straight lines, and 2025 was no exception. While the year had its ups and downs, it also offered valuable lessons about patience and long-term thinking. In this review, we will take a closer look at the key events and major themes of the year, and what we believe matters most moving forward.
As we move into 2026, our focus remains on being thoughtful stewards of your investments. In a year shaped by uncertainty and change, we believe careful decision-making matters more than quick reactions. Markets will always react to headlines, but long-term success comes from staying grounded, patient, and intentional.
Rather than chasing trends, we emphasize diversifying your investments among businesses that are well run, have highly profitable goods and services that people want, and that pay you cash in return for your investment. This approach helps protect portfolios during periods of fluctuation while positioning them to grow over time.
At the end of the day, markets will continue to evolve, headlines will come and go, and uncertainty will always be part of investing. Our role is to help you stay grounded through it all by making thoughtful decisions, staying flexible when needed, and keeping your long-term goals in the center stage. By focusing on what we can control and being wary of what we cannot, we can look forward to the next year with clarity and confidence.
I have gone into more detail below and would be happy to answer any questions you may have.
I hope you have all had a wonderful close to your 2025, and I’m looking forward to meeting with you and having a great 2026 together.
- Emma Shaw
Inflation stayed in the spotlight throughout 2025 as investors and policymakers tried to figure out if rising prices were truly beginning to come under control. The most common way to track how quickly prices are increasing is by looking at the Consumer Price Index (CPI), which measures the cost of everyday items like food, gas, housing, and medical care. When CPI goes up, it means things are getting more expensive, and when CPI goes down, it means price increases are starting to slow.
At the start of 2025, CPI inflation was around 3%, which is higher than the Federal Reserve’s long-term goal of 2%. By the end of the first quarter, inflation cooled to around 2.4%, which was a positive sign that pricing pressures were starting to let up. However, progress was not linear, and CPI moved back up to roughly 2.7% by mid-year and hovered close to 3% again by early fall before going back down below 2.7%.
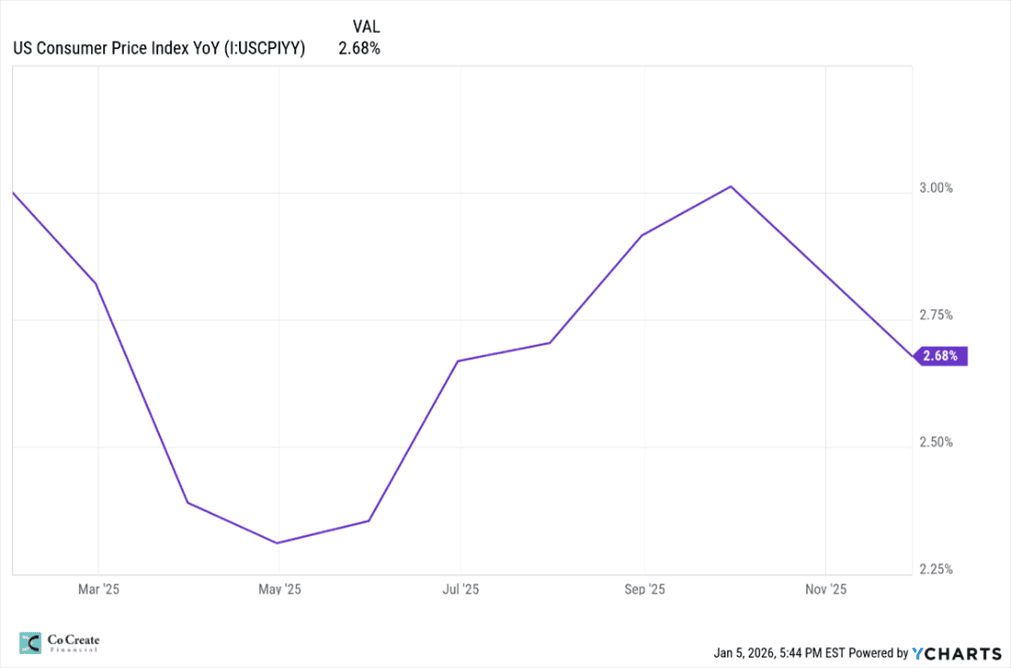
The graph above tracks CPI inflation over the course of the year. The line moving down means inflation is slowing, while the line moving up means inflation is picking back up. This back-and-forth pattern we can see explains why inflation continued to feel frustratingly “sticky,” even when some areas of the economy improved.
But the uneven path of inflation in 2025 is not a complete surprise, inflation rarely dissipates quickly, and expecting a smooth decline is not totally realistic. It’s normal for progress to stall or even reverse temporarily, especially when wages and housing costs remain elevated.
For investors, this backs up the importance of remaining patient and not overreacting to shorter-term data. The stabilization process is complex, made up of many various interlocking elements that move at different paces.
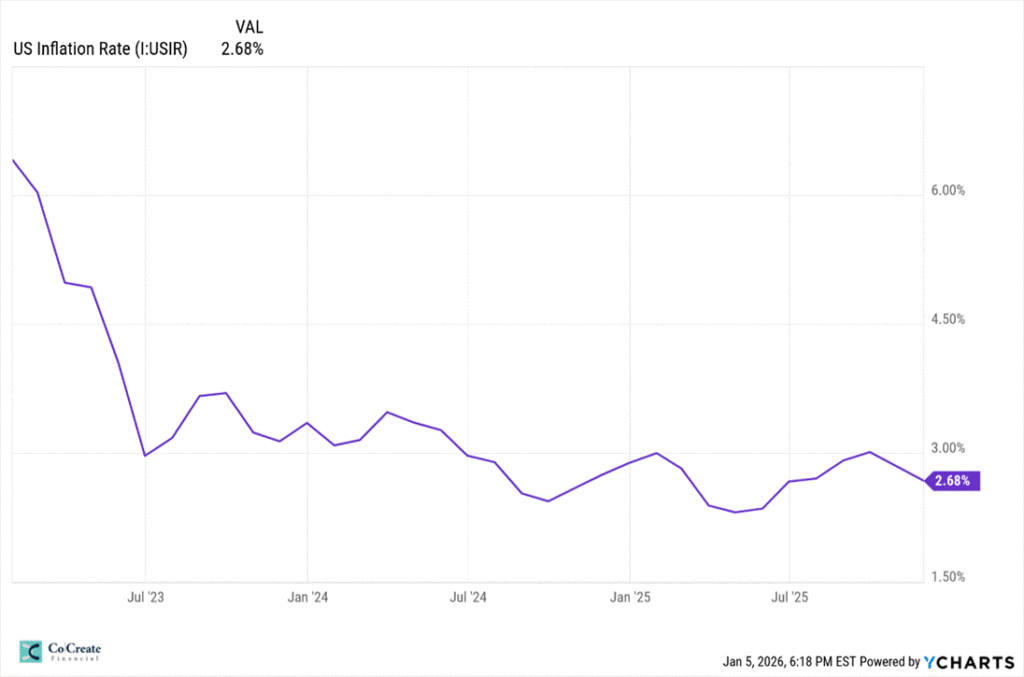
This graph depicts the U.S. inflation rate over the past three years. The broader trend still points towards gradual improvement, and we can navigate the uncertainty by remaining diversified, focusing on fundamentals, and avoiding emotional decisions based on fleeting headlines.
Throughout 2025, central banks, led by the Federal Reserve, took a cautious approach to interest rate decisions. After raising interest rates aggressively in prior years to fight inflation, policymakers shifted towards a slower, more thoughtful strategy.
Interest rates deal with the cost of borrowing money. When rates go up, loans become more expensive and spending tends to slow. When rates go down, loans become cheaper and spending increases. One of the Federal Reserve’s duties is to adjust rates to help keep inflation under control while also supporting economic growth.
Since inflation moved up and down during the year, expectations surrounding possible rate cuts were inconsistent. At times, investors expected rates to fall sooner, but when inflation readings came in higher, the Fed signaled it was willing to wait to make a move until they had a more complete picture.
Federal Reserve Chair Jerome Powell repeatedly emphasized that decisions would depend on clear progress in the data, not on what markets hoped would happen. The Fed needed tangible proof that inflation was improving.
On December 10, the Fed lowered interest rates by 25 basis points, which equals 0.25%. This was the third rate cut of the year. These small cuts suggest growing confidence that inflation is moving in the right direction, but again, these things take time and rate cuts do not bring change overnight.
Even as inflation started to cool, borrowing money remained expensive throughout much of 2025. Mortgage rates remained high, adding to the slower activity in the housing market and affecting affordability for buyers and refinancers. Higher monthly payments made homes less affordable, and fewer people chose to refinance their existing mortgages. This kept many buyers on the sidelines and reduced overall housing demand.
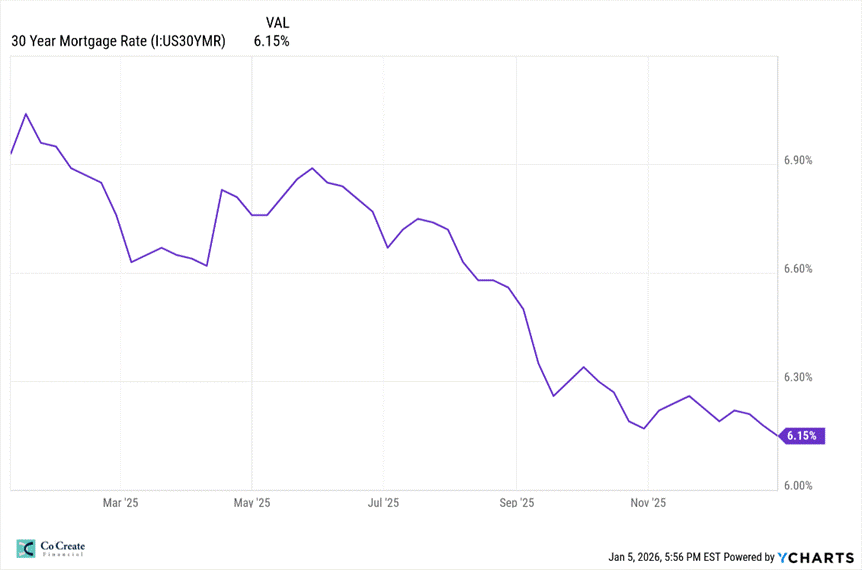
The chart above tracks the 30-year fixed mortgage rate, which is the most common home loan in the U.S. The line shows how mortgage rates moved throughout the year. When the line goes down, borrowing becomes slightly cheaper. When it stays high, monthly payments remain a challenge for buyers.
Although mortgage rates declined some towards the end of the year, they remained well above the low levels we’ve seen in other years, finishing around 6.15%. While this drop offered some relief, rates were still high enough to limit affordability for many households.
Higher interest rates also affected businesses. Companies faced higher financing costs, which made them more cautious about expanding, hiring, and investing in new projects. For consumers, borrowing became more expensive across credit cards, auto loans, and personal loans, making everyday purchases harder to finance and encouraging households to be more selective with spending.
Mortgage rates will take longer to come down, even if the Federal Reserve continues to cut interest rates. While rate cuts help lower short-term borrowing costs, mortgage rates are influenced by more than just Fed policy. Meaningful relief for homebuyers will require steady improvement in inflation and economic stability over time.
Interest rate movements had a broad impact on markets in 2025. Bond prices moved as rate expectations shifted. When interest rates stay high, existing bonds lose value, but new bonds offer higher yields, meaning better income potential going forward.
Stocks also experienced periods of volatility throughout the year. Higher interest rates make borrowing more expensive for companies and reduce the value of their future earnings, which can put pressure on stock prices. As investors adjusted to these conditions, markets reacted more sharply to economic data and rate expectations.
Despite short term swings, the higher-rate environment reinforced the importance of diversification. Balanced portfolios tended to perform more steadily, as income-generating assets played a larger role and helped offset equity volatility.
Economic growth in 2025 was more resilient than many early forecasts suggested. While higher interest rates were expected to significantly slow down activity, overall GDP growth remained positive, though more moderate than in prior years. GDP is a simple way to measure the health of the economy. It represents the total value of all goods and services produced in a country over a certain period. On the one hand, the U.S. economy continued to expand at a steady pace rather than experiencing any sharp contractions, showing its ability to adapt to tighter financial conditions. On the other hand, AI investment was responsible for approximately 92% of GDP growth in 2025 and tariffs appear to be costing about 1% of GDP.
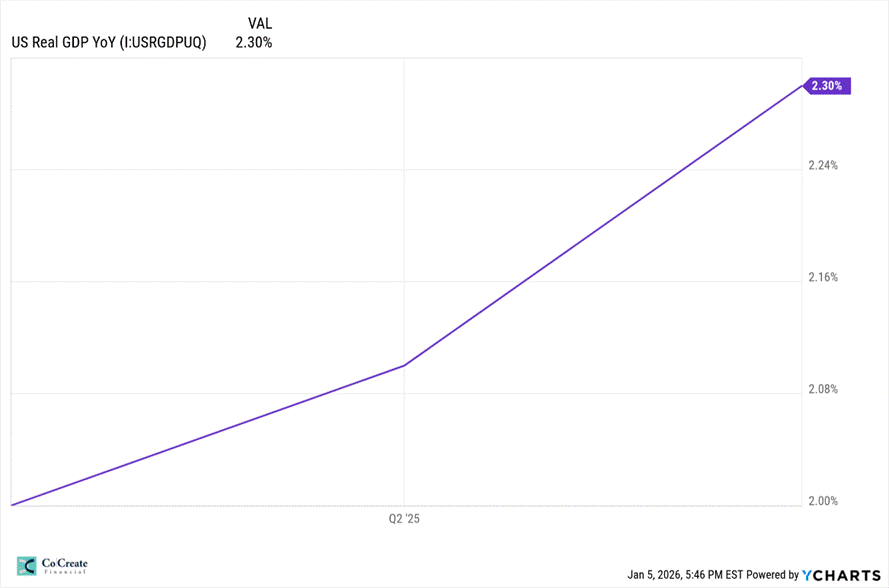
As we can see in the graph above, which measures U.S. GDP throughout 2025, the slower pace of growth suggests the economy is settling into a healthier balance. Instead of growing too fast or slowing down too much, businesses and consumers adjusted their spending and investment decisions at a more sustainable pace.
The job market remained relatively stable throughout the year, though hiring slowed compared to the rapid pace seen in recent years. According to the Bureau of Labor Statistics (BLS), total employment continued to grow, particularly in areas like health care and service-related jobs. The unemployment rate, which measures the number of people actively looking for work but unable to find it, edged slightly higher but remained near normal historical levels. This leads to a cooling job market rather than a major slowdown. As I’ve mentioned before, employers just became more selective with hiring as interest rates stayed high and economic growth softened. One notable change was a 9.2% decline in federal government employment, as hiring slowed and some government roles were reduced. This contributed to the overall deceleration of job growth.
Consumer spending in 2025 remained stronger than expected, despite the higher interest rates and prices that continued to impact people’s budgets. Solid employment and steady wage growth allowed many households to keep spending, especially on everyday needs, which helped support overall economic growth. However, when it came to discretionary purchases, consumers were much more cautious.
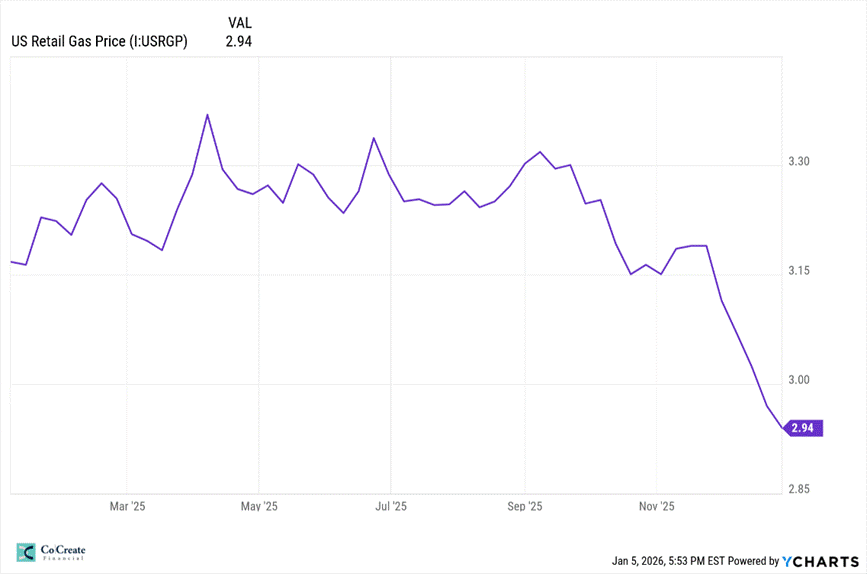
This U.S. Retail Gas Price graph highlights a positive for consumers, and a possible factor as to why people were able to keep spending. Gas prices fluctuated during the year but declined towards the end of 2025, finishing just under $3 per gallon. These lower gas prices could have helped free up budgets and allow for more spending elsewhere.
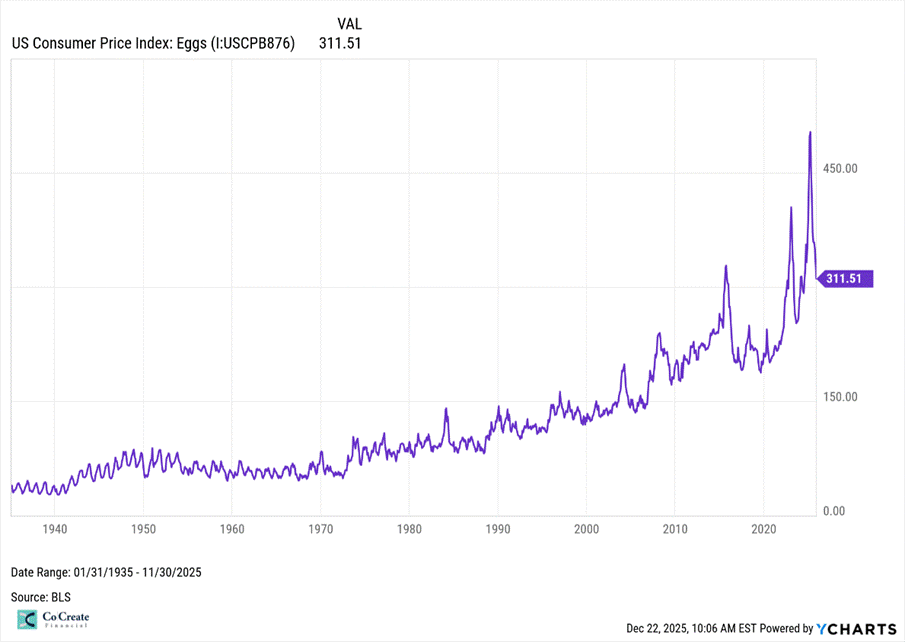
However, this long-term chart tracking egg prices tells a different story. While prices naturally rise over time due to inflation, the sharp increases in recent years stand out compared to historical trends. Eggs are a basic household staple, so rising prices here highlight how higher everyday costs have become more noticeable for consumers (if you’re spending $311 on eggs, you must be buying the Costco-size package).
Consumer spending in 2025 was less about excess and more about adaptation, which we’ve seen is a common theme in the overall market. Instead of cutting spending dramatically and abruptly, people adjusted how and where they spent their money. Lower fuel prices helped offset higher costs elsewhere but persistent increases in everyday items, like groceries, kept consumers cautious. From the start of the year, people felt a lot of hesitation as the economy sent mixed signals and pulled sentiment in different directions. Despite the concerns, the economy proved to be more resilient than many initially had expected.
2025 was a year of adjustment and adaptation. Market reactions were shaped by big policy shifts, political headlines, and changing expectations surrounding inflation and interest rates. While there were times of volatility, investors spent much of the year dealing with uncertainty and navigating the complex economic environment. Several key events and themes stood out and played a vital role in shaping market behavior.
In early April, on a day coined “Liberation Day”, the President announced broad tariffs on imported goods. The announcement triggered sharp and immediate market reactions, stocks fell quickly as investors tried to assess the potential impacts on inflation, global trade, and corporate profits.
As the year progressed, markets stabilized as people received more clarity about how the tariffs would be implemented and which industries would be most affected. While uncertainty remained during periods of negotiation, the initial shock faded as expectations adjusted.
Ongoing global trade tensions and the influx of new tariff policies added another layer of unpredictability. Rising trade barriers and high-profile negotiations influenced expectations for economic growth and international investment.
At times, discussions about scaling back harsher policies helped restore market sentiment, but renewed tensions would harm confidence once again. The shifting dynamics made long-term planning more difficult for businesses and investors.
Inflation continued to cool compared to prior years, but pricing pressures remained a central concern for investors, policymakers, and the everyday American. Even as progress was made, inflation did not drop quickly or smoothly.
Market reactions were often influenced more by headlines and policy signals than by long-term fundamentals, however this is not surprising nor rare. Short-term swings are natural, but the constant changes in policies emphasized the influence of these swings.
The rapid rise of artificial intelligence became a defining theme of 2025. Companies connected to AI saw massive increases in valuation as investors rushed to gain exposure to next “best” thing. Much of the AI investment came from the AI industry itself. We’ve discussed AI in previous articles and will be continuing to unpack the risks and opportunities.
But concerns about an “AI bubble” emerged, as people began to grow wary of the super high stock prices that did not seem to be in line with AI companies’ financial situation, leading to even more volatility within the industry. Moreover, there is an abundance of evidence that those implementing AI are NOT yet seeing a return on their investment.[1] We have been careful to limit our exposure to the risks of the AI industry throughout the year.
Fiscal policy remained a key theme in 2025, including changes to tax policy and ongoing debates over government spending.
New legislation extended and modified tax provisions for businesses and individuals, but the effects of “The One, Big, Beautiful Bill” were uneven across industries, with some sectors benefiting more than others.
The 43-day government shutdown that began in October 2025 and finally ended mid-November added to the ambiguity. While the shutdown was resolved, it brought even more short-term volatility and disrupted government services and personnel.
[1] https://mlq.ai/media/quarterly_decks/v0.1_State_of_AI_in_Business_2025_Report.pdf;
CFO Outlook for 2026: Tariffs, Hiring, Prices, and AI Impact | Richmond Fed
